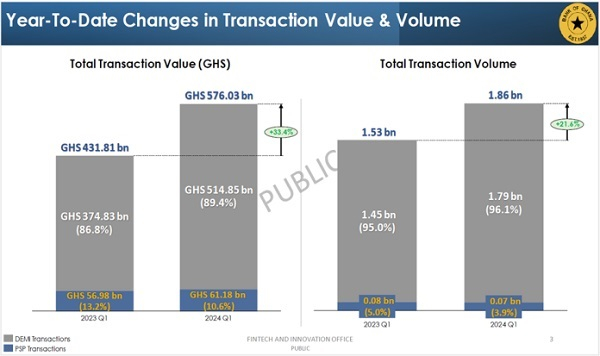
In Q1 2024, the total value of transactions through Fintech platforms surged to GH¢576.03billion, up from GH¢431.81billion the previous year, reflecting a 33.4 percent increase.
The latest Fintech sector report by the FinTech and Innovation Office of the Bank of Ghana, underscores this growth as the continuous expanding reliance on digital financial services, reinforcing its vital role in the financial ecosystem.
The report highlights that Dedicated Electronic Money Issuers (DEMIs) contributed significantly to this rise, with their transactions increasing from GH¢374.83billion in Q1 2023 to GH¢514.85billion in Q1 2024. Payment service providers (PSPs) also saw a modest increase from GH¢56.98billion to GH¢61.18billion over the same period.
Transaction volumes followed a similar upward trajectory. The total number of transactions reached 1.86 billion in Q1 2024, up from 1.53 billion in Q1 2023, marking a 21.6 percent increase. DEMI transactions accounted for the majority, growing from 1.45 billion to 1.79 billion transactions, while PSP transactions saw a slight decrease from 0.08 billion to 0.07 billion, indicating a consolidation of volume in the DEMI segment.
Quarterly performance
A closer examination of quarterly data reveals dynamic shifts. The value of agent-to-agent transactions grew by 5 percent from GH¢163.67billion in Q4 2023 to GH¢171.19billion in Q1 2024.
Similarly, wallet-to-bank (W2B) transactions, excluding those processed by the Ghana Interbank Payment and Settlement Systems (GhIPSS), increased by 4 percent from GH¢36.94billion to GH¢38.33billion. However, there was a slight decline in third-party transactions, which fell by 4 percent from GH¢99.87billion to GH¢96.22billion, possibly indicating a shift toward direct transactions.
The report categorises transactions into several product types, each contributing differently to the total transaction values. Circulating transactions, which include person-to-person and agent-to-agent transactions, accounted for 39 percent of the total in Q1 2023; but slightly decreased to 41 percent in Q1 2024.
Cash-in and cash-out transactions maintained steady contributions, emphasising the continued importance of converting physical cash into digital money and vice versa. Digital transactions, including airtime top-up, ATM withdrawals and bill payments, represented a significant portion of the overall transaction value, highlighting the versatility and expanding utility of mobile money services.
Mobile money transaction dynamics
Mobile money remains a cornerstone of the Fintech sector. The distribution of mobile money transaction values and volumes reflects diverse usage patterns. Agent-to-agent transactions dominated the value distribution at 30 percent, followed by third-party transfers at 17 percent, and cash-out transactions at 11 percent.
In terms of volume, airtime top-ups led with 18 percent, followed closely by third-party transfers and data/product purchases at 17 percent and 15 percent, respectively. These figures indicate a broadening adoption of mobile money for everyday financial activities beyond basic transfers.
The number of active mobile money wallets continued to grow, reaching 23.4 million in March 2024, up from 22.9 million in January 2024. This growth is indicative of increasing consumer trust and reliance on mobile money platforms for daily transactions. Similarly, the number of active agents supporting these transactions increased to 616,000 by March 2024, up from 608,000 in January 2024, ensuring that the infrastructure keeps pace with the growing user base.
The float balance, representing the total funds held in mobile money accounts, also experienced significant growth. By March 2024, the balance had risen to GH¢18.69billion, a substantial increase from GH¢12.82billion in February 2023. This 45.8 percent growth underscores the deepening financial engagement and liquidity within the mobile money ecosystem.

Business News of Wednesday, 22 May 2024
Source: thebftonline.com


